A tiny sensor tracks the noise around it 24/7 in dB(A), sends the data automatically, and turns it into a dashboard anyone can read — live levels, exceedances, loudest peaks and trends. Indicative acoustic monitoring to understand and document traffic and neighbourhood noise.

Chronic noise is linked to disturbed sleep, raised stress and cardiovascular strain — the WHO ranks environmental noise among the top environmental risks to health in Europe. You can't fix what you can't see. Mute makes it visible.
And it isn't only us — wildlife pays for the constant noise too. Everyone deserves a bit of quiet.
It measures continuously, catches every threshold exceedance, classifies it by severity, and turns the raw decibels into one dashboard you can actually read, prove and act on.
Continuous sound levels, second by second, day and night.
Every threshold exceedance, caught and timestamped automatically.
Each event classified by severity, from moderate to extreme.
Days and weeks side by side — better, or worse?
Export reports, document complaints, prove compliance.
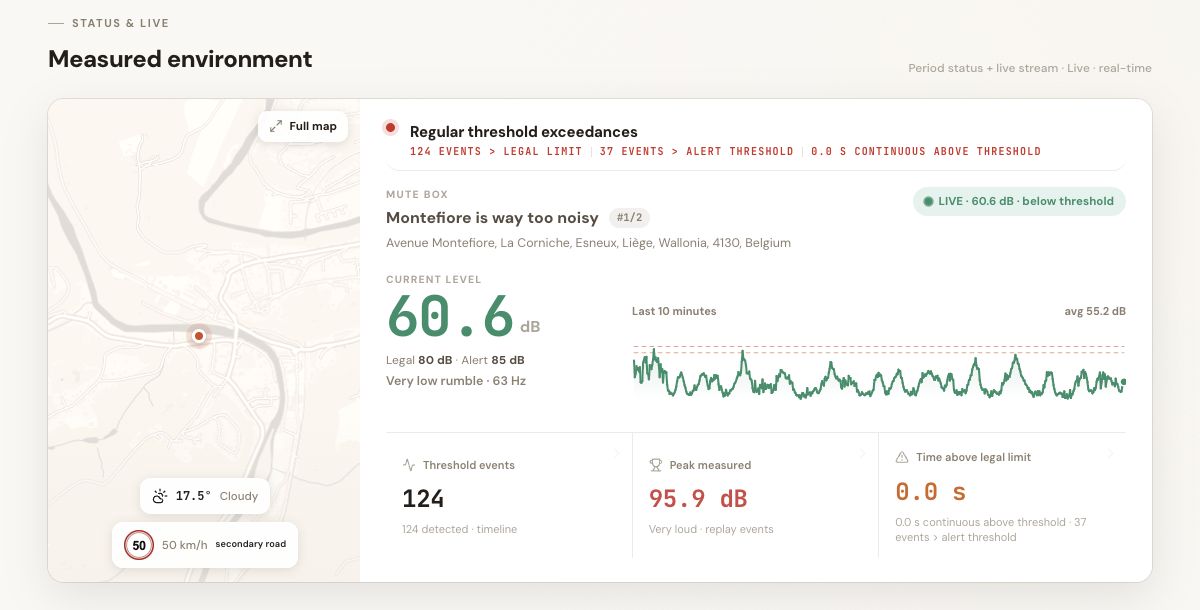
The live level at a glance, on a map, against your legal limit and your own alert threshold — with the last 10 minutes streaming in real time.
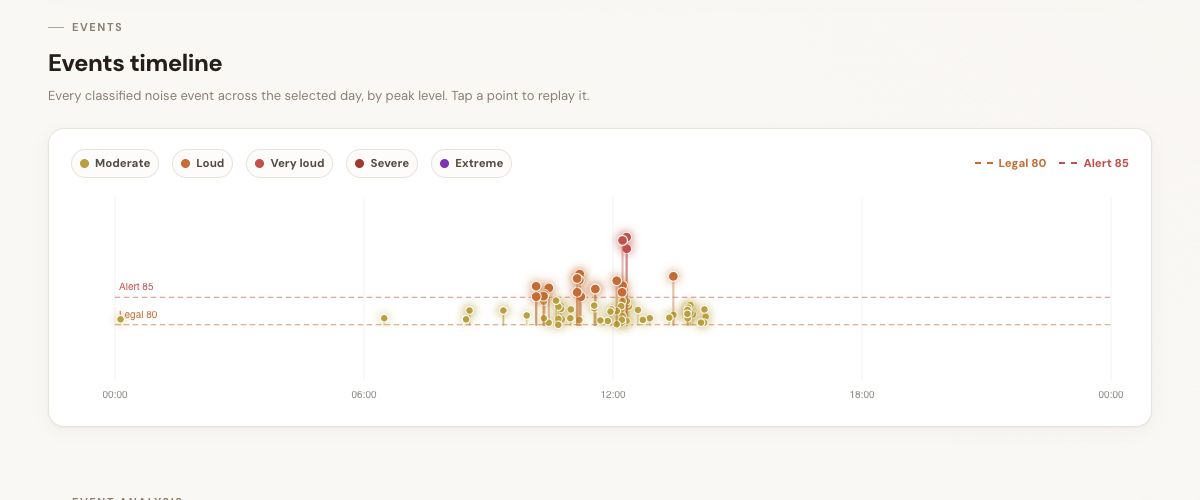
Every classified noise event across the day, plotted by peak level. Tap any point to replay exactly what happened and when.
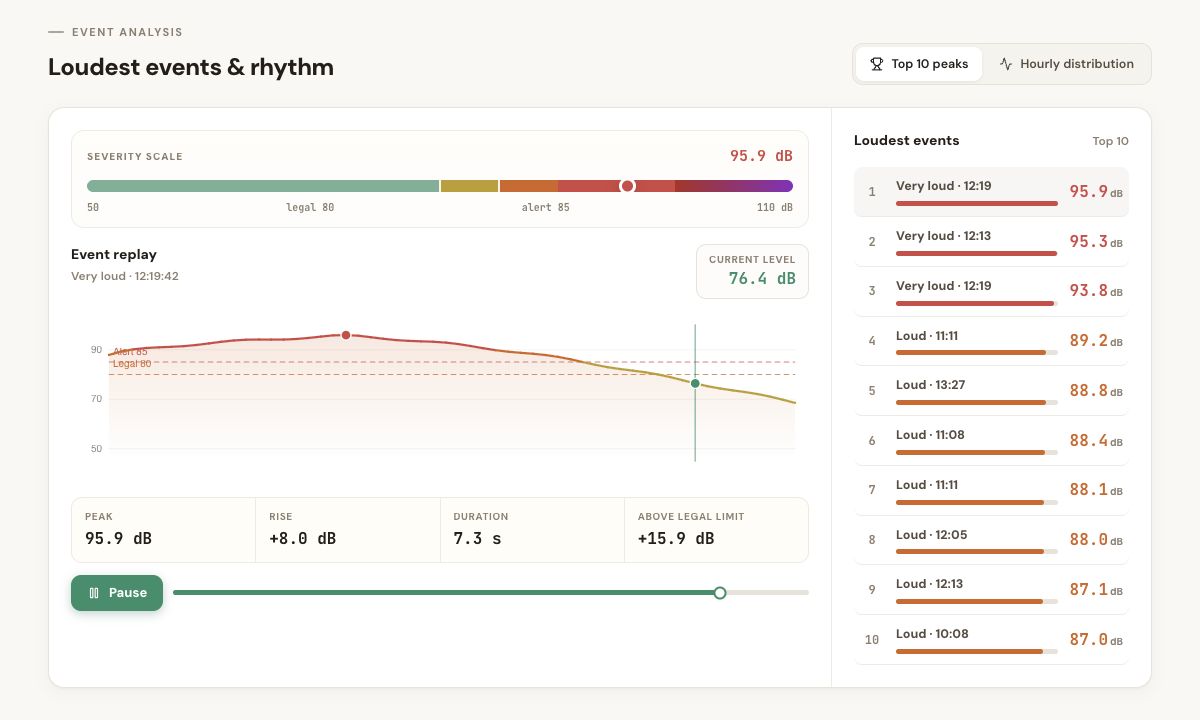
Your top peaks ranked, an event replay with peak, rise and duration, and the hourly rhythm that tells you exactly when it gets loud.
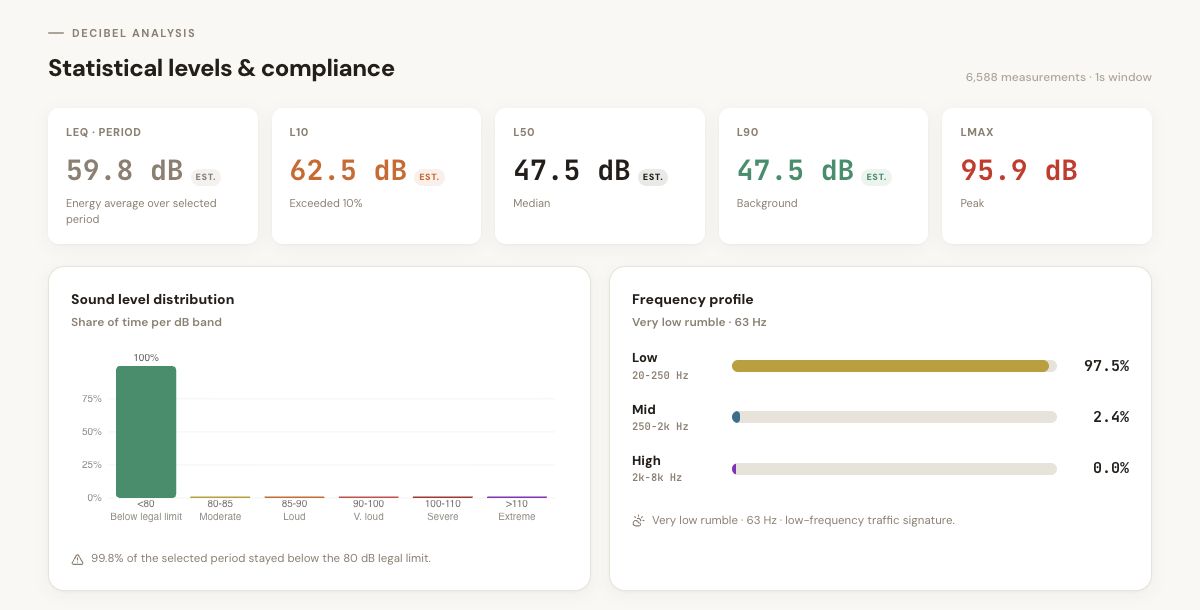
The acoustic indicators that matter — LEQ, L10, L50, L90 and LMAX — plus the share of time per dB band and a frequency profile of the noise.
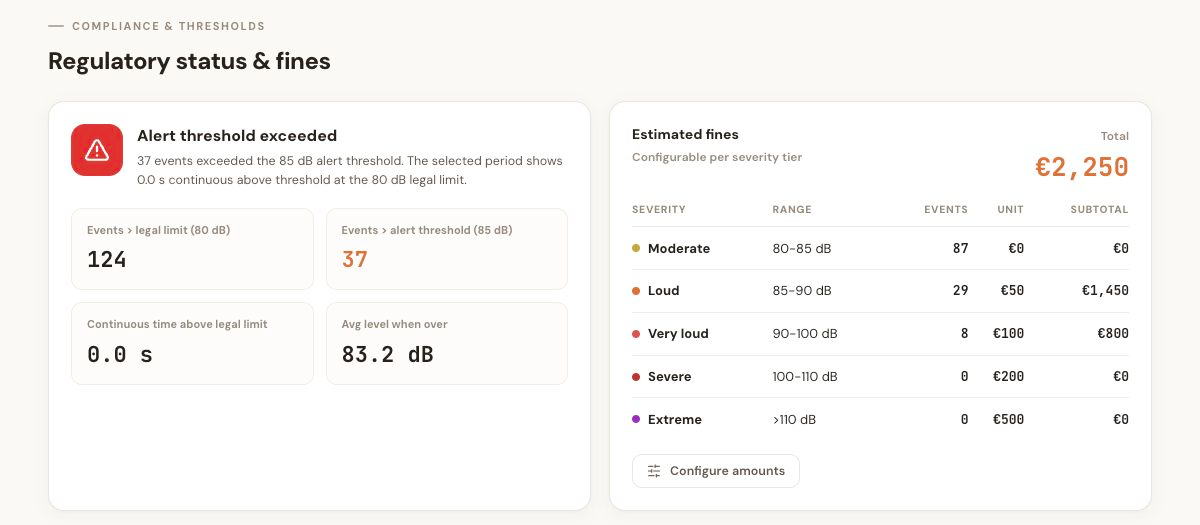
Count exceedances against the legal limit and your alert threshold, then simulate what they would cost — configurable per severity tier.
A single measurement tells you what's happening now. Trends reads the story from your sound data — how your noise behaves week over week, hour by hour — and projects where it's heading. Local weather is layered in on top to sharpen the picture and explain the peaks. Green means quieter, red means louder. No interpretation needed.
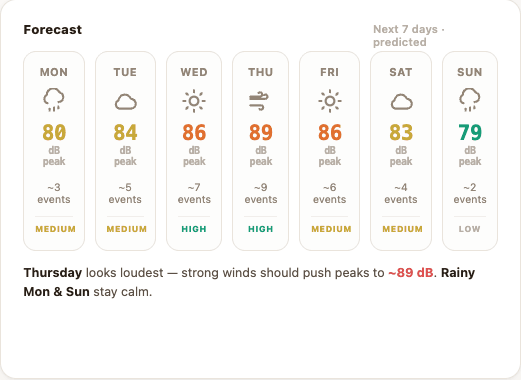
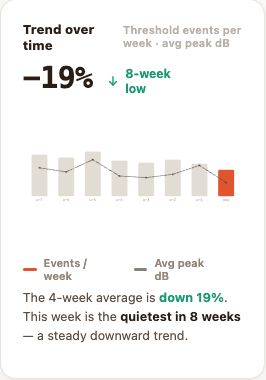
From your own sound history, Trends projects the weeks ahead and tells you plainly whether it's improving or getting worse.
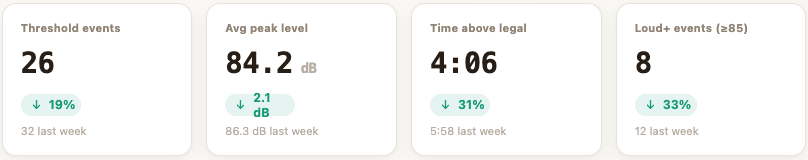
This week vs last, this month vs last — events, average peak and time over the limit, with every change spelled out.
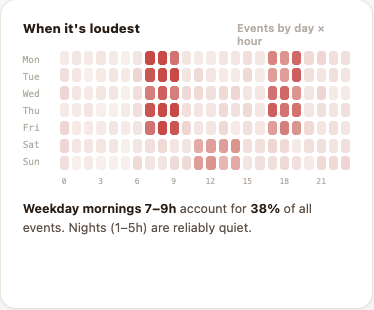
A day × hour heatmap surfaces the recurring noisy windows. An optional weather layer then explains what moves your peaks.
Noise is everywhere, so the uses are too. Whatever the situation, it comes down to the same thing: measured, timestamped proof instead of "it feels too loud". A few of the most common:
Keep your team and your premises below the noise limits that apply to you — and hold a timestamped record to document the situation if anyone asks.
Traffic, a nightclub, a noisy workshop next door? Mute logs every exceedance with a timestamp — so your complaint is backed by data, not your word against theirs.
Run your event watching the exact level at every moment — and keep a clean documentation report afterwards. Indicative monitoring, but objective numbers everyone can read.
Set an alert threshold and get an email or notification the moment a party kicks off in your property — before the neighbours call. No cameras, no microphones, just sound levels.
Drop a battery-powered Mute Box for a week at the place you're about to buy, and read the real noise profile on your dashboard — mornings, nights and weekends — before you commit.
Turn "it's too noisy" into measured data: identify problem zones, track thresholds and follow trends street by street, with continuous coverage instead of a one-off study.
No technician, no calibration ritual. Power it, claim it, and watch your first measurements land.
Plug in and switch on.
Join an available network.
The box shows a QR — scan to claim it.
Give your box a clear name.
Choose the surroundings.
Set your reference + alert level.
Place it on the map.
Your data is live.

Optional — the box and its dashboard work fine on their own. But we love Home Assistant, so the box auto-discovers as a native ESPHome device: live dB readings and threshold automations, no add-ons or bridges.
A one-off acoustician captures a single moment. Heavy professional systems cost a fortune. Mute is continuous, affordable, and the dashboard is included.
One-off acoustician A specialist visit |
Heavy pro systems Industrial monitoring |
Mute Box Continuous & included |
|
|---|---|---|---|
| Cost | Expensive per visit | Very high upfront | €99 early-bird (€149 public) |
| Coverage | A single moment | Continuous | Continuous, 24/7 |
| Setup | Scheduling & delays | Complex installation | Minutes, plug & play |
| Dashboard included | Report only | Often extra | Yes, built in |
| Trends & forecast | No | Rarely | Built in |
| Time to first data | Days to weeks | Weeks | Minutes |
Pre-calibrated, plug & play, dashboard included. Indicative dB(A) monitoring to understand and document the noise around you. Join the waitlist now — and explore the live dashboard while you wait.